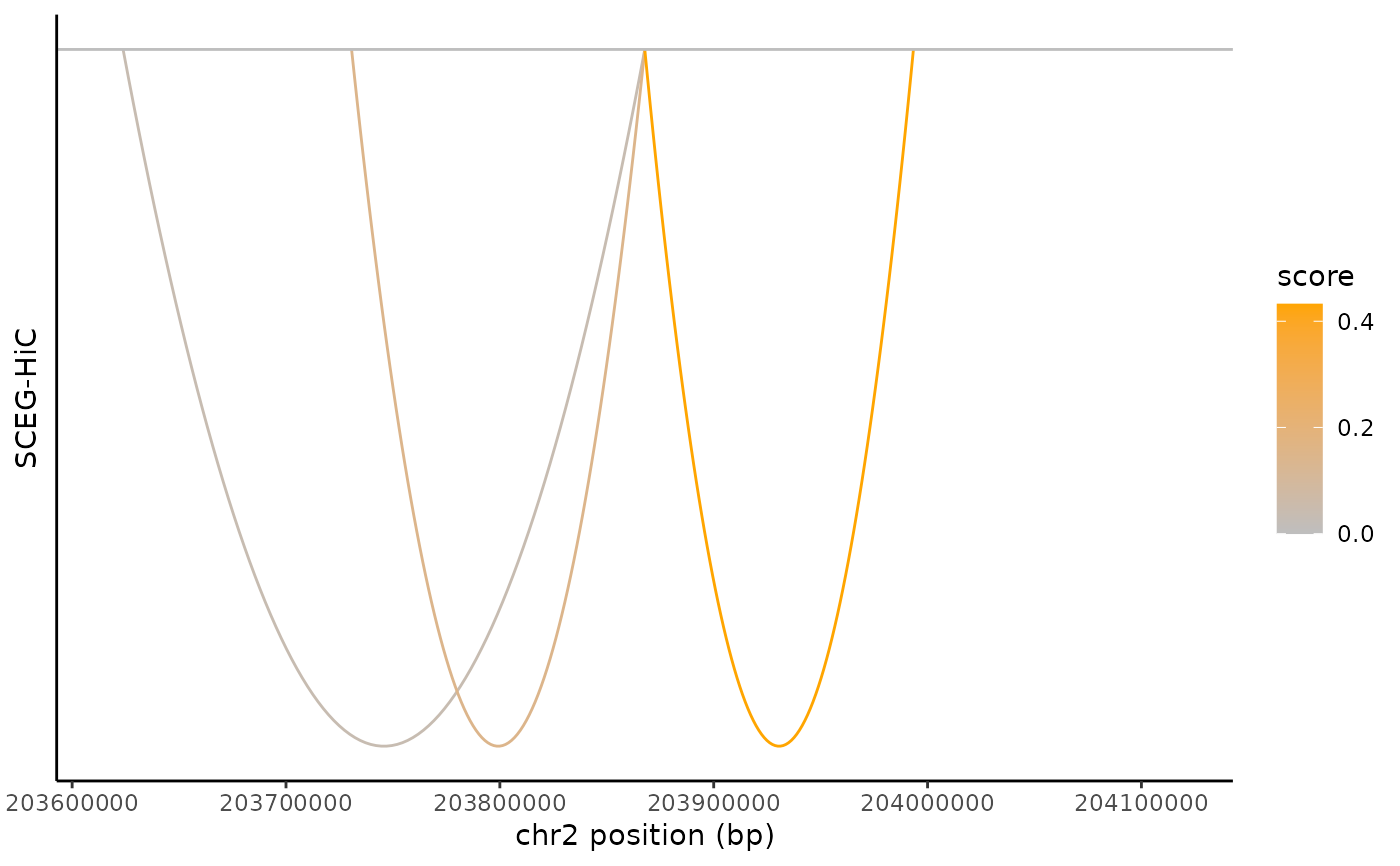
Visualize predicted links between genomic elements (e.g., genes and regulatory peaks) within a specified genomic region.
Arguments
- links
A data.frame containing enhancer-gene links.
- gene_anno
A
data.frameorNULL. If provided, should be compatible with theGeneRegionTrack-class. Column names must not containNA.- gene
A character string specifying the target gene to highlight.
- region
A
GRangesobject specifying the genomic region to plot.- lowcolor
Color for the lowest scores in the gradient.
- highcolor
Color for the highest scores in the gradient.
- titlename
A character string specifying the title of the plot.
Value
A ggplot object visualizing enhancer-gene links.
Examples
links <- data.frame(
  gene = "CTLA4", peak = c("chr2_203623664_203623982", "chr2_203730093_203731243", "chr2_203992800_203993979"),
  score = c(0.03623216, 0.14814205, 0.43240254)
)
library(GenomicRanges)
#> Loading required package: stats4
#> Loading required package: BiocGenerics
#>
#> Attaching package: 'BiocGenerics'
#> The following objects are masked from 'package:stats':
#>
#>     IQR, mad, sd, var, xtabs
#> The following objects are masked from 'package:base':
#>
#>     Filter, Find, Map, Position, Reduce, anyDuplicated, aperm, append,
#>     as.data.frame, basename, cbind, colnames, dirname, do.call,
#>     duplicated, eval, evalq, get, grep, grepl, intersect, is.unsorted,
#>     lapply, mapply, match, mget, order, paste, pmax, pmax.int, pmin,
#>     pmin.int, rank, rbind, rownames, sapply, saveRDS, setdiff, table,
#>     tapply, union, unique, unsplit, which.max, which.min
#> Loading required package: S4Vectors
#>
#> Attaching package: 'S4Vectors'
#> The following object is masked from 'package:utils':
#>
#>     findMatches
#> The following objects are masked from 'package:base':
#>
#>     I, expand.grid, unname
#> Loading required package: IRanges
#> Loading required package: GenomeInfoDb
region <- GRanges(seqnames = Rle("chr2"), ranges = IRanges(start = 203617771, end = 204117772))
gene_anno <- annotateTSS("Homo sapiens", "hg38")
colnames(gene_anno) <- c("chr", "gene", "tss")
links <- LinksPlot(links, gene_anno, gene = "CTLA4", region, lowcolor = "blue", highcolor = "orange", titlename = "SCEG-HiC")
links