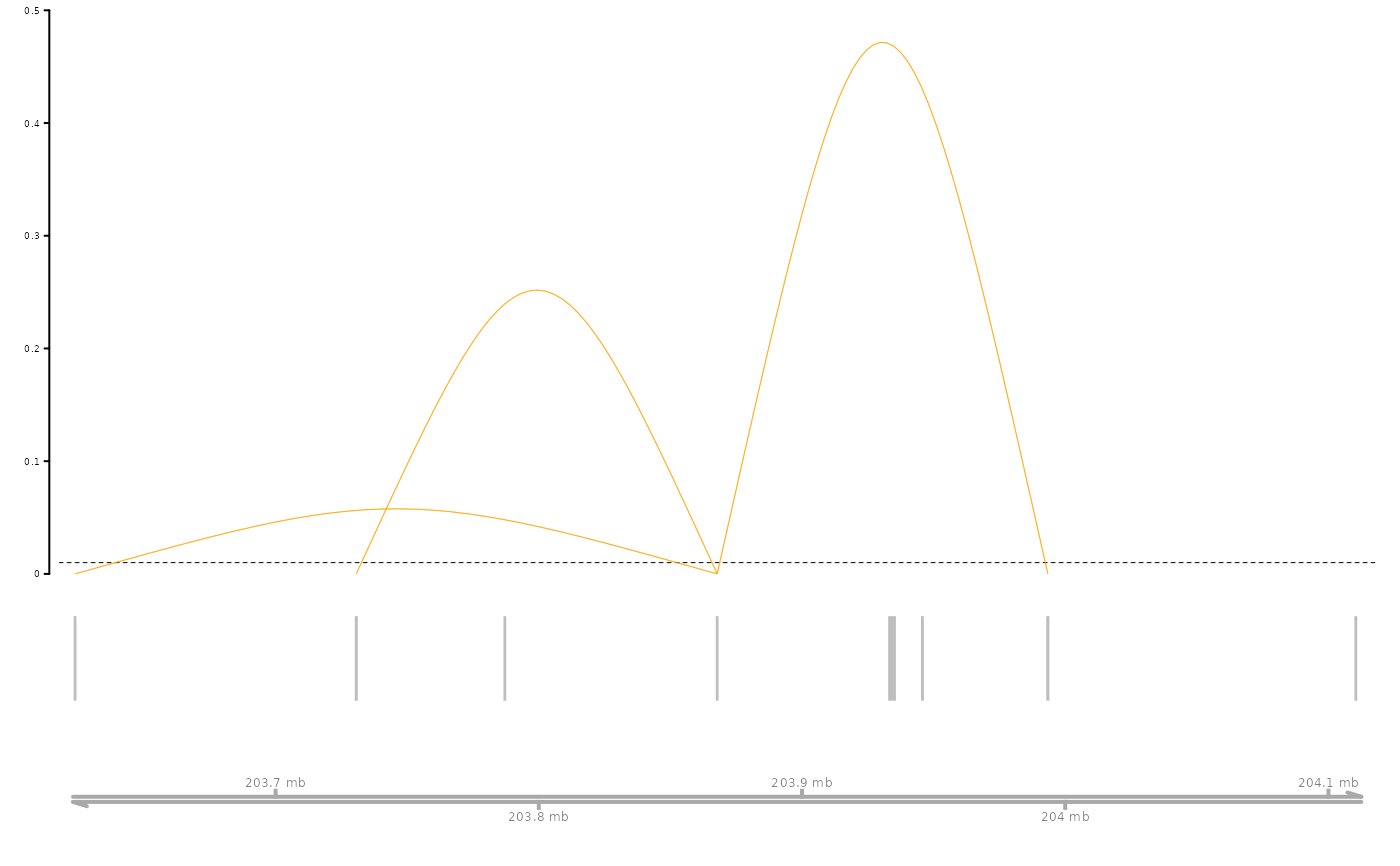
Visualizes the predicted enhancer-gene links from SCEG-HiC for a given gene by plotting them in a genome region view.
Usage
connections_Plot(
  SCEG_HiC_Result,
  species,
  genome,
  focus_gene,
  cutoff = NULL,
  upstream = 250000,
  downstream = 250000,
  gene_anno = NULL
)
Arguments
- SCEG_HiC_Result
A data.frame containing the output from
Run_SCEG_HiC().- species
Character string specifying the species name. Supported values are "Homo sapiens" or "Mus musculus".
- genome
Character string specifying the genome assembly. Supported values are "hg38", "hg19", "mm10", or "mm9".
- focus_gene
A character vector of gene symbols to focus on.
- cutoff
Threshold for selecting gene-peak pairs. Default is
NULL. Ifaggregate = TRUE, we recommend settingcutoff = 0.01. Ifaggregate = FALSE, we recommendcutoff = 0.001.- upstream
Numeric specifying the number of base pairs upstream of each TSS to define enhancers. Default is 250,000 bp (250 kb).
- downstream
Numeric specifying the number of base pairs downstream of each TSS to define enhancers. Default is 250,000 bp (250 kb).
- gene_anno
A
data.frameorNULL. If provided, should be compatible with theGeneRegionTrack-class. Column names must not containNA.
Value
A genome browser-style plot displaying the focused gene and predicted enhancer-gene connections.
Examples
#' data(multiomic_small)
SCEGdata <- process_data(multiomic_small, k_neigh = 5, max_overlap = 0.5)
#> Generating aggregated data
#> Aggregating cluster 0
#> Sample cells randomly.
#> There are 11 samples
#> Aggregating cluster 1
#> Sample cells randomly.
#> There are 11 samples
fpath <- system.file("extdata", package = "SCEGHiC")
gene <- c("TRABD2A", "GNLY", "MFSD6", "CTLA4", "LCLAT1", "NCK2", "GALM", "TMSB10", "ID2", "CXCR4")
weight <- calculateHiCWeights(SCEGdata, species = "Homo sapiens", genome = "hg38", focus_gene = gene, averHicPath = fpath)
#> Processing chromosome chr2...
#> Found 10 TSS loci on chr2.
#> Calculating Hi-C weights for gene TRABD2A...
#> Calculating Hi-C weights for gene GNLY...
#> Calculating Hi-C weights for gene MFSD6...
#> Calculating Hi-C weights for gene CXCR4...
#> Calculating Hi-C weights for gene CTLA4...
#> Calculating Hi-C weights for gene LCLAT1...
#> Calculating Hi-C weights for gene NCK2...
#> Calculating Hi-C weights for gene ID2...
#> Calculating Hi-C weights for gene GALM...
#> Calculating Hi-C weights for gene TMSB10...
#> Finished calculating Hi-C weights for all genes.
results_SCEGHiC <- Run_SCEG_HiC(SCEGdata, weight, focus_gene = gene)
#> Total predicted genes: 10
#> Running model for gene: TRABD2A
#> [1] "The optimal penalty parameter (rho) selected by BIC is: 0.43"
#> Running model for gene: GNLY
#> [1] "The optimal penalty parameter (rho) selected by BIC is: 0.19"
#> Running model for gene: MFSD6
#> [1] "The optimal penalty parameter (rho) selected by BIC is: 0.22"
#> Running model for gene: CXCR4
#> [1] "The optimal penalty parameter (rho) selected by BIC is: 0.14"
#> Running model for gene: CTLA4
#> [1] "The optimal penalty parameter (rho) selected by BIC is: 0.17"
#> Running model for gene: LCLAT1
#> [1] "The optimal penalty parameter (rho) selected by BIC is: 0.41"
#> Running model for gene: NCK2
#> [1] "The optimal penalty parameter (rho) selected by BIC is: 0.25"
#> Running model for gene: ID2
#> [1] "The optimal penalty parameter (rho) selected by BIC is: 0.13"
#> Running model for gene: GALM
#> [1] "The optimal penalty parameter (rho) selected by BIC is: 0.11"
#> Running model for gene: TMSB10
#> [1] "The optimal penalty parameter (rho) selected by BIC is: 0.44"
connections_Plot(results_SCEGHiC, species = "Homo sapiens", genome = "hg38", focus_gene = "CTLA4", cutoff = 0.01, gene_anno = NULL)