Plot SCEG-HiC Links and Tn5 Insertion Frequency Over a Genomic Region
Source:R/visualization.R
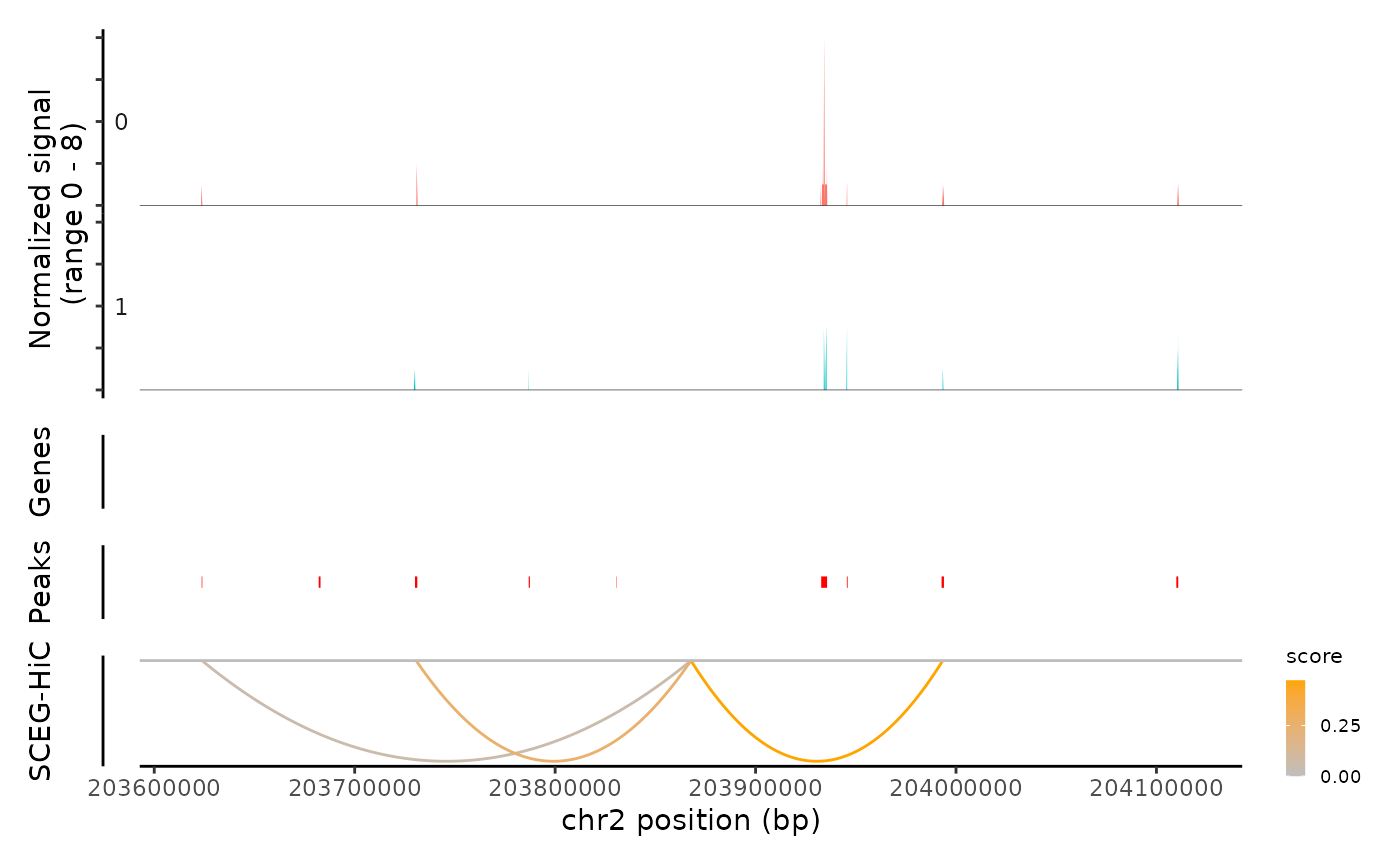
coverPlot.RdThis function visualizes Tn5 insertion signal across a given genomic window centered on a focus gene, and overlays predicted and validated gene-enhancer (gene-peak) links.
Usage
coverPlot(
  object,
  focus_gene,
  species,
  genome,
  assay = NULL,
  upstream = 250000,
  downstream = 250000,
  HIC_Result = NULL,
  HIC_cutoff = 0,
  SCEG_HiC_Result = NULL,
  SCEG_HiC_cutoff = 0,
  correlation = NULL,
  cells = NULL,
  cellnames = NULL,
  eqtl.positions = NULL
)
Arguments
- object
A Seurat object.
- focus_gene
A character vector of gene symbols to focus on.
- species
Character string specifying the species name. Supported values are "Homo sapiens" or "Mus musculus".
- genome
Character string specifying the genome assembly. Supported values are "hg38", "hg19", "mm10", or "mm9".
- assay
Character or vector. Assay(s) to use. The first assay determines gene annotations and link metadata.
- upstream
Numeric specifying the number of base pairs upstream of each TSS to define enhancers. Default is 250,000 bp (250 kb).
- downstream
Numeric specifying the number of base pairs downstream of each TSS to define enhancers. Default is 250,000 bp (250 kb).
- HIC_Result
Data.frame. Hi-C gene-peak interaction result with columns
gene,peak,score.- HIC_cutoff
Numeric. Score threshold for Hi-C links. Default: 0.
- SCEG_HiC_Result
A data.frame containing the output from
Run_SCEG_HiC().- SCEG_HiC_cutoff
Numeric. Score threshold for SCEG-HiC links. Recommend 0.01 for aggregated, 0.001 for single-cell.
- correlation
Data.frame. Correlation-based gene-peak links.
- cells
Character vector. Subset of cells to include.
- cellnames
Character vector. Name(s) of one or more metadata columns used to group the cells. Default is the current cell identities.
- eqtl.positions
Numeric vector. Genomic positions of eQTL variants (optional).
Value
A patchwork plot.
Details
The output includes:
Tn5 insertion signal across cell groups
Links predicted by SCEG-HiC
Hi-C validated links
Correlation-based links
eQTL variants (optional)
Peak positions
Examples
data(multiomic_small)
SCEGdata <- process_data(multiomic_small, k_neigh = 5, max_overlap = 0.5)
#> Generating aggregated data
#> Aggregating cluster 0
#> Sample cells randomly.
#> There are 11 samples
#> Aggregating cluster 1
#> Sample cells randomly.
#> There are 11 samples
fpath <- system.file("extdata", package = "SCEGHiC")
gene <- c("TRABD2A", "GNLY", "MFSD6", "CTLA4", "LCLAT1", "NCK2", "GALM", "TMSB10", "ID2", "CXCR4")
weight <- calculateHiCWeights(SCEGdata, species = "Homo sapiens", genome = "hg38", focus_gene = gene, averHicPath = fpath)
#> Processing chromosome chr2...
#> Found 10 TSS loci on chr2.
#> Calculating Hi-C weights for gene TRABD2A...
#> Calculating Hi-C weights for gene GNLY...
#> Calculating Hi-C weights for gene MFSD6...
#> Calculating Hi-C weights for gene CXCR4...
#> Calculating Hi-C weights for gene CTLA4...
#> Calculating Hi-C weights for gene LCLAT1...
#> Calculating Hi-C weights for gene NCK2...
#> Calculating Hi-C weights for gene ID2...
#> Calculating Hi-C weights for gene GALM...
#> Calculating Hi-C weights for gene TMSB10...
#> Finished calculating Hi-C weights for all genes.
results_SCEGHiC <- Run_SCEG_HiC(SCEGdata, weight, focus_gene = gene)
#> Total predicted genes: 10
#> Running model for gene: TRABD2A
#> [1] "The optimal penalty parameter (rho) selected by BIC is: 0.43"
#> Running model for gene: GNLY
#> [1] "The optimal penalty parameter (rho) selected by BIC is: 0.19"
#> Running model for gene: MFSD6
#> [1] "The optimal penalty parameter (rho) selected by BIC is: 0.22"
#> Running model for gene: CXCR4
#> [1] "The optimal penalty parameter (rho) selected by BIC is: 0.14"
#> Running model for gene: CTLA4
#> [1] "The optimal penalty parameter (rho) selected by BIC is: 0.17"
#> Running model for gene: LCLAT1
#> [1] "The optimal penalty parameter (rho) selected by BIC is: 0.41"
#> Running model for gene: NCK2
#> [1] "The optimal penalty parameter (rho) selected by BIC is: 0.25"
#> Running model for gene: ID2
#> [1] "The optimal penalty parameter (rho) selected by BIC is: 0.13"
#> Running model for gene: GALM
#> [1] "The optimal penalty parameter (rho) selected by BIC is: 0.11"
#> Running model for gene: TMSB10
#> [1] "The optimal penalty parameter (rho) selected by BIC is: 0.44"
fpath <- system.file("extdata", "multiomic_small_atac_fragments.tsv.gz", package = "SCEGHiC")
library(Signac)
frags <- CreateFragmentObject(path = fpath, cells = colnames(multiomic_small))
#> Computing hash
Fragments(multiomic_small) <- frags
coverPlot(multiomic_small, focus_gene = "CTLA4", species = "Homo sapiens", genome = "hg38", assay = "peaks", SCEG_HiC_Result = results_SCEGHiC, SCEG_HiC_cutoff = 0.01)
#> Warning: The 2 combined objects have no sequence levels in common. (Use
#>   suppressWarnings() to suppress this warning.)